Data X-Ray
Data X-Ray decorates the page you're looking at with the network requests that produced its visible content. Crop-select a region of a page, and tweak matches the text you see against the responses it captured, badges the matching elements, and lets you open, edit and import any of those requests as a tweak rule, without leaving the page or digging through the Network panel.
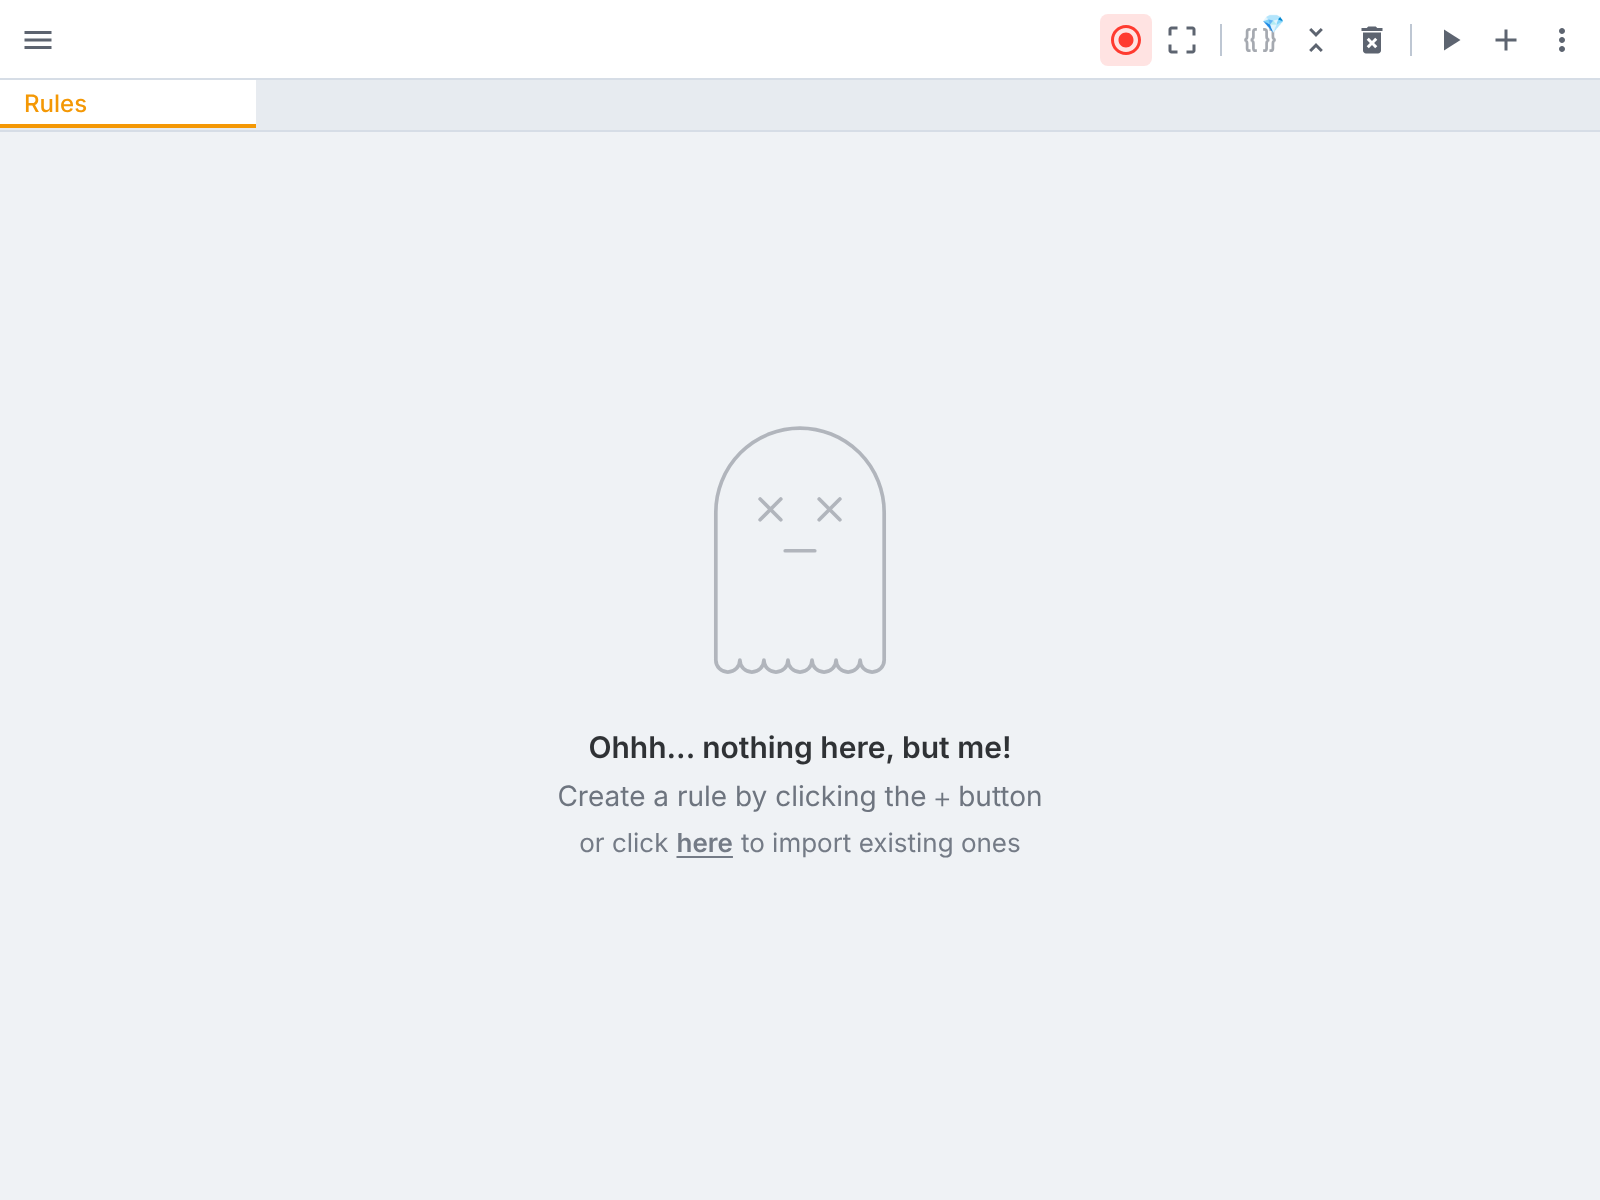
Enable request capture
Data X-Ray works off the same background request capture used to prefill rules from captured requests. Before scanning a page:
- Click the capture icon in the top bar to start recording requests triggered on the current tab.
- Trigger the requests that render the content you want to inspect (reload the page, navigate, interact with the UI, whatever produces the network calls).
The crop icon next to it (labelled Data X-Ray) stays disabled until at least one request has been captured.
Select a region
Click the Data X-Ray button, then drag a selection box over the part of the page you want to inspect. You don't need to be pixel-precise, tweak will attempt to fuzzy match text within the selected area against the various payloads of all the requests captured so far.
Every element whose text was found in a response gets a dashed outline, and a {;} badge (or a GraphQL badge when applicable) appears at its top-right corner:
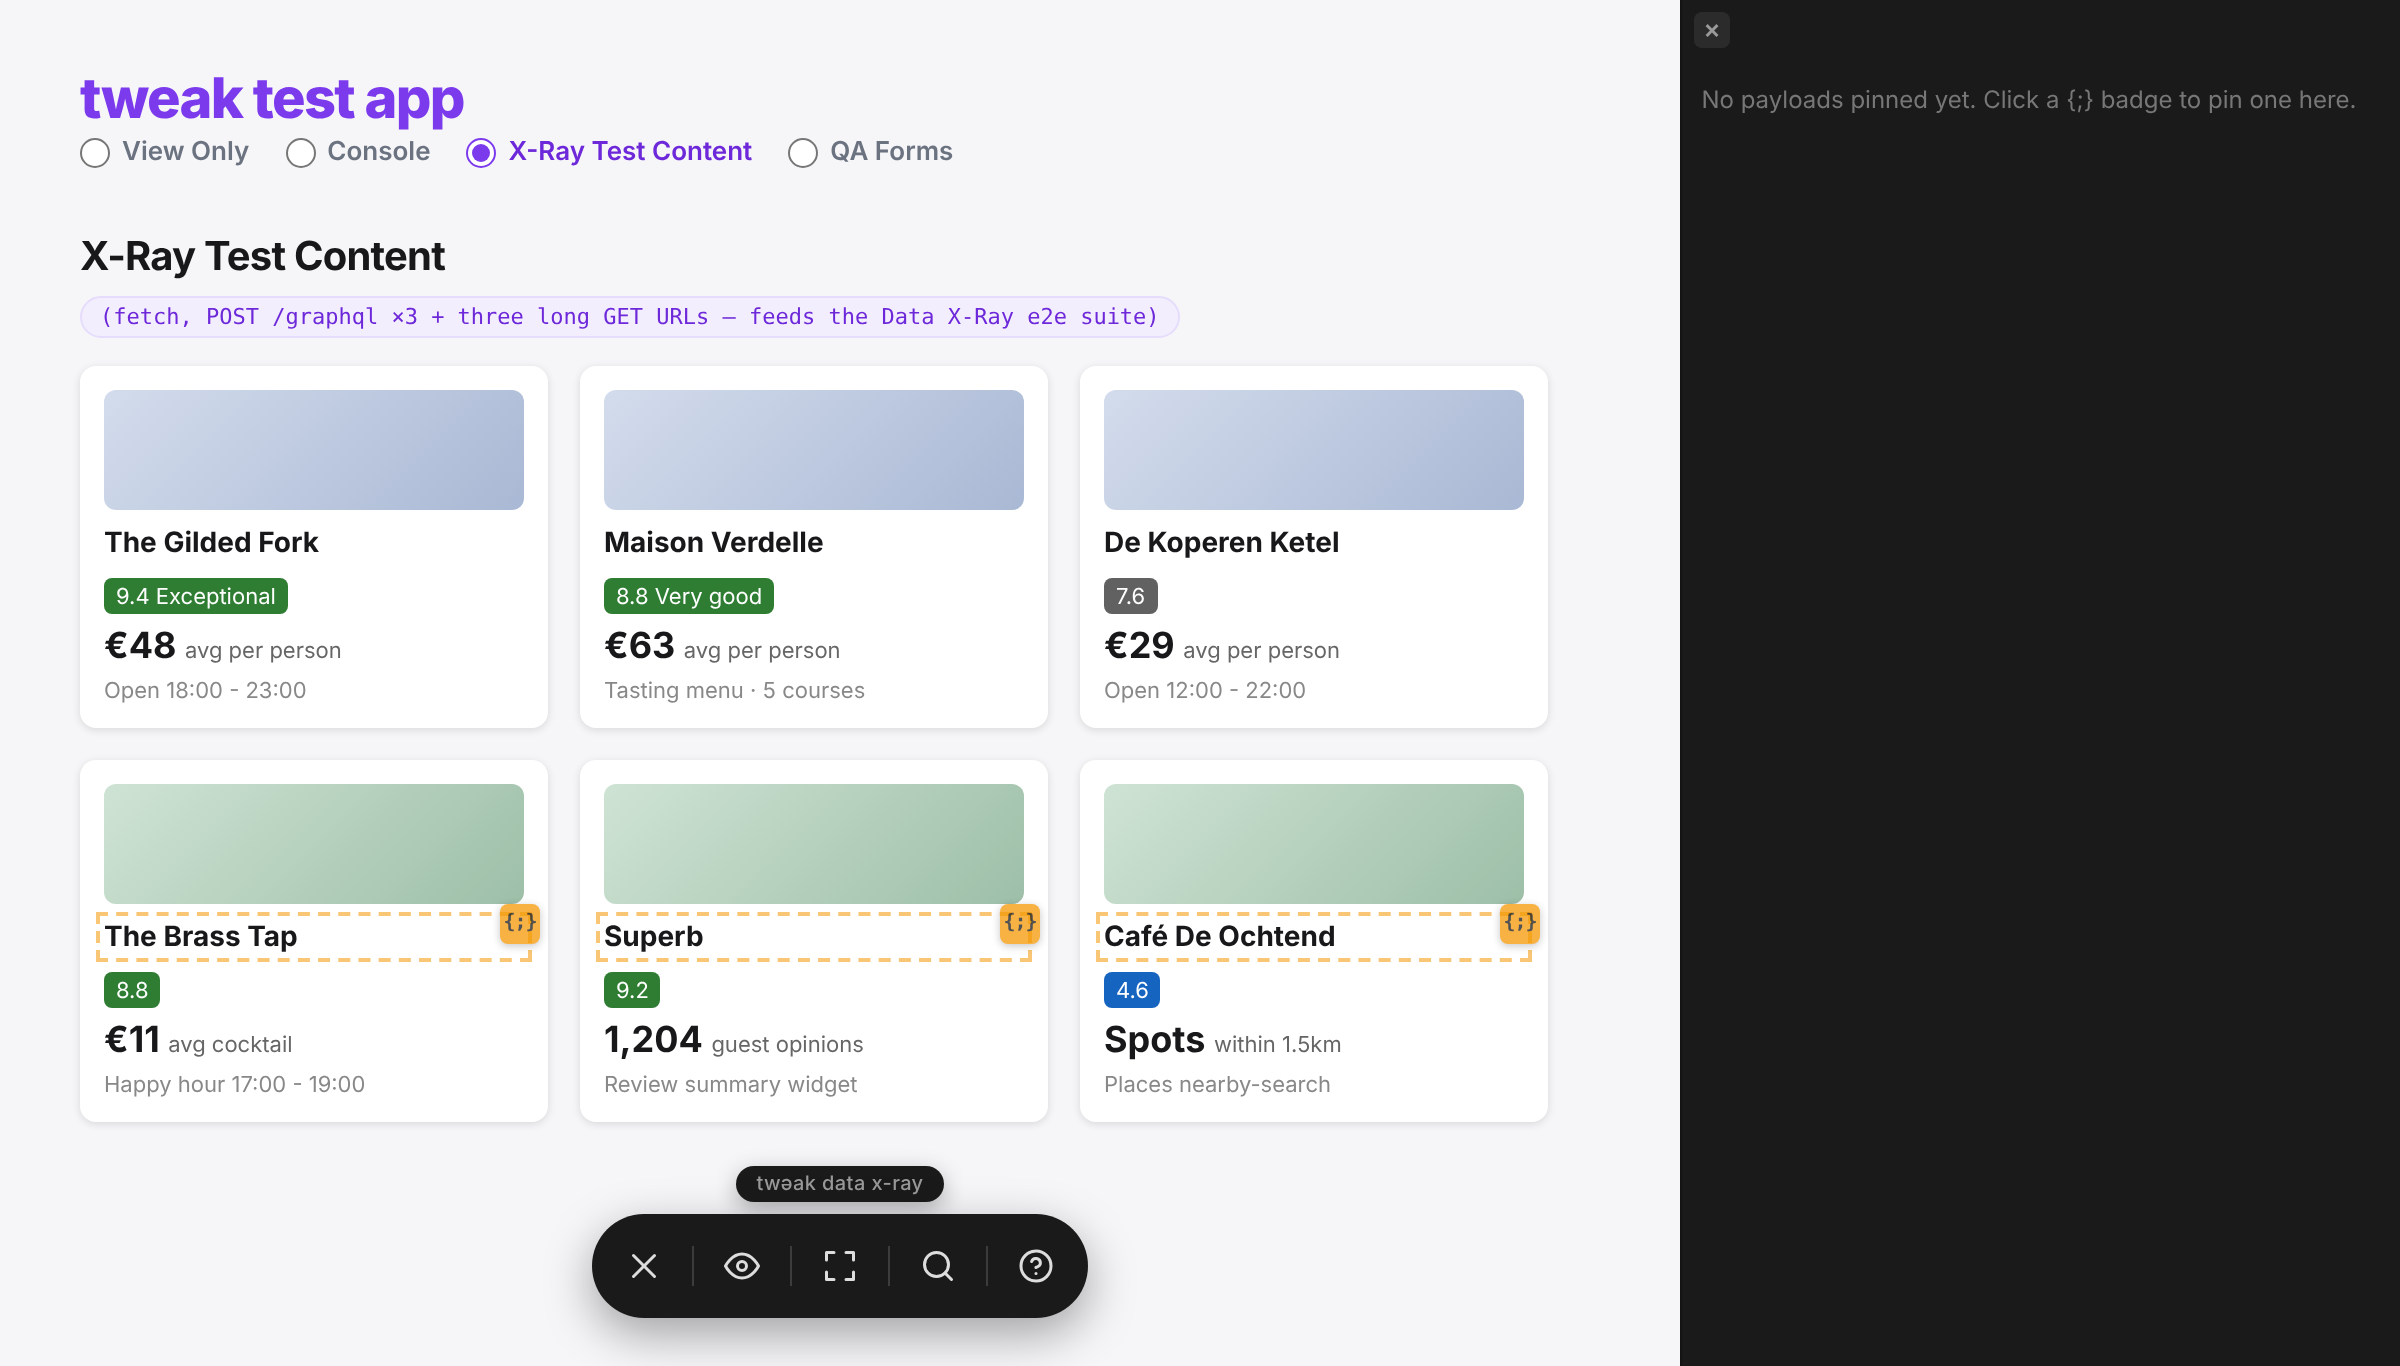
Matching is deliberately conservative: misattribution is worse than no badge. A piece of text only gets decorated when tweak is confident about which request produced it, so don't be surprised if some visually obvious data doesn't get a badge, which usually means the match wasn't unambiguous enough (a generic single word appearing in multiple responses, for example).
Inspect a request
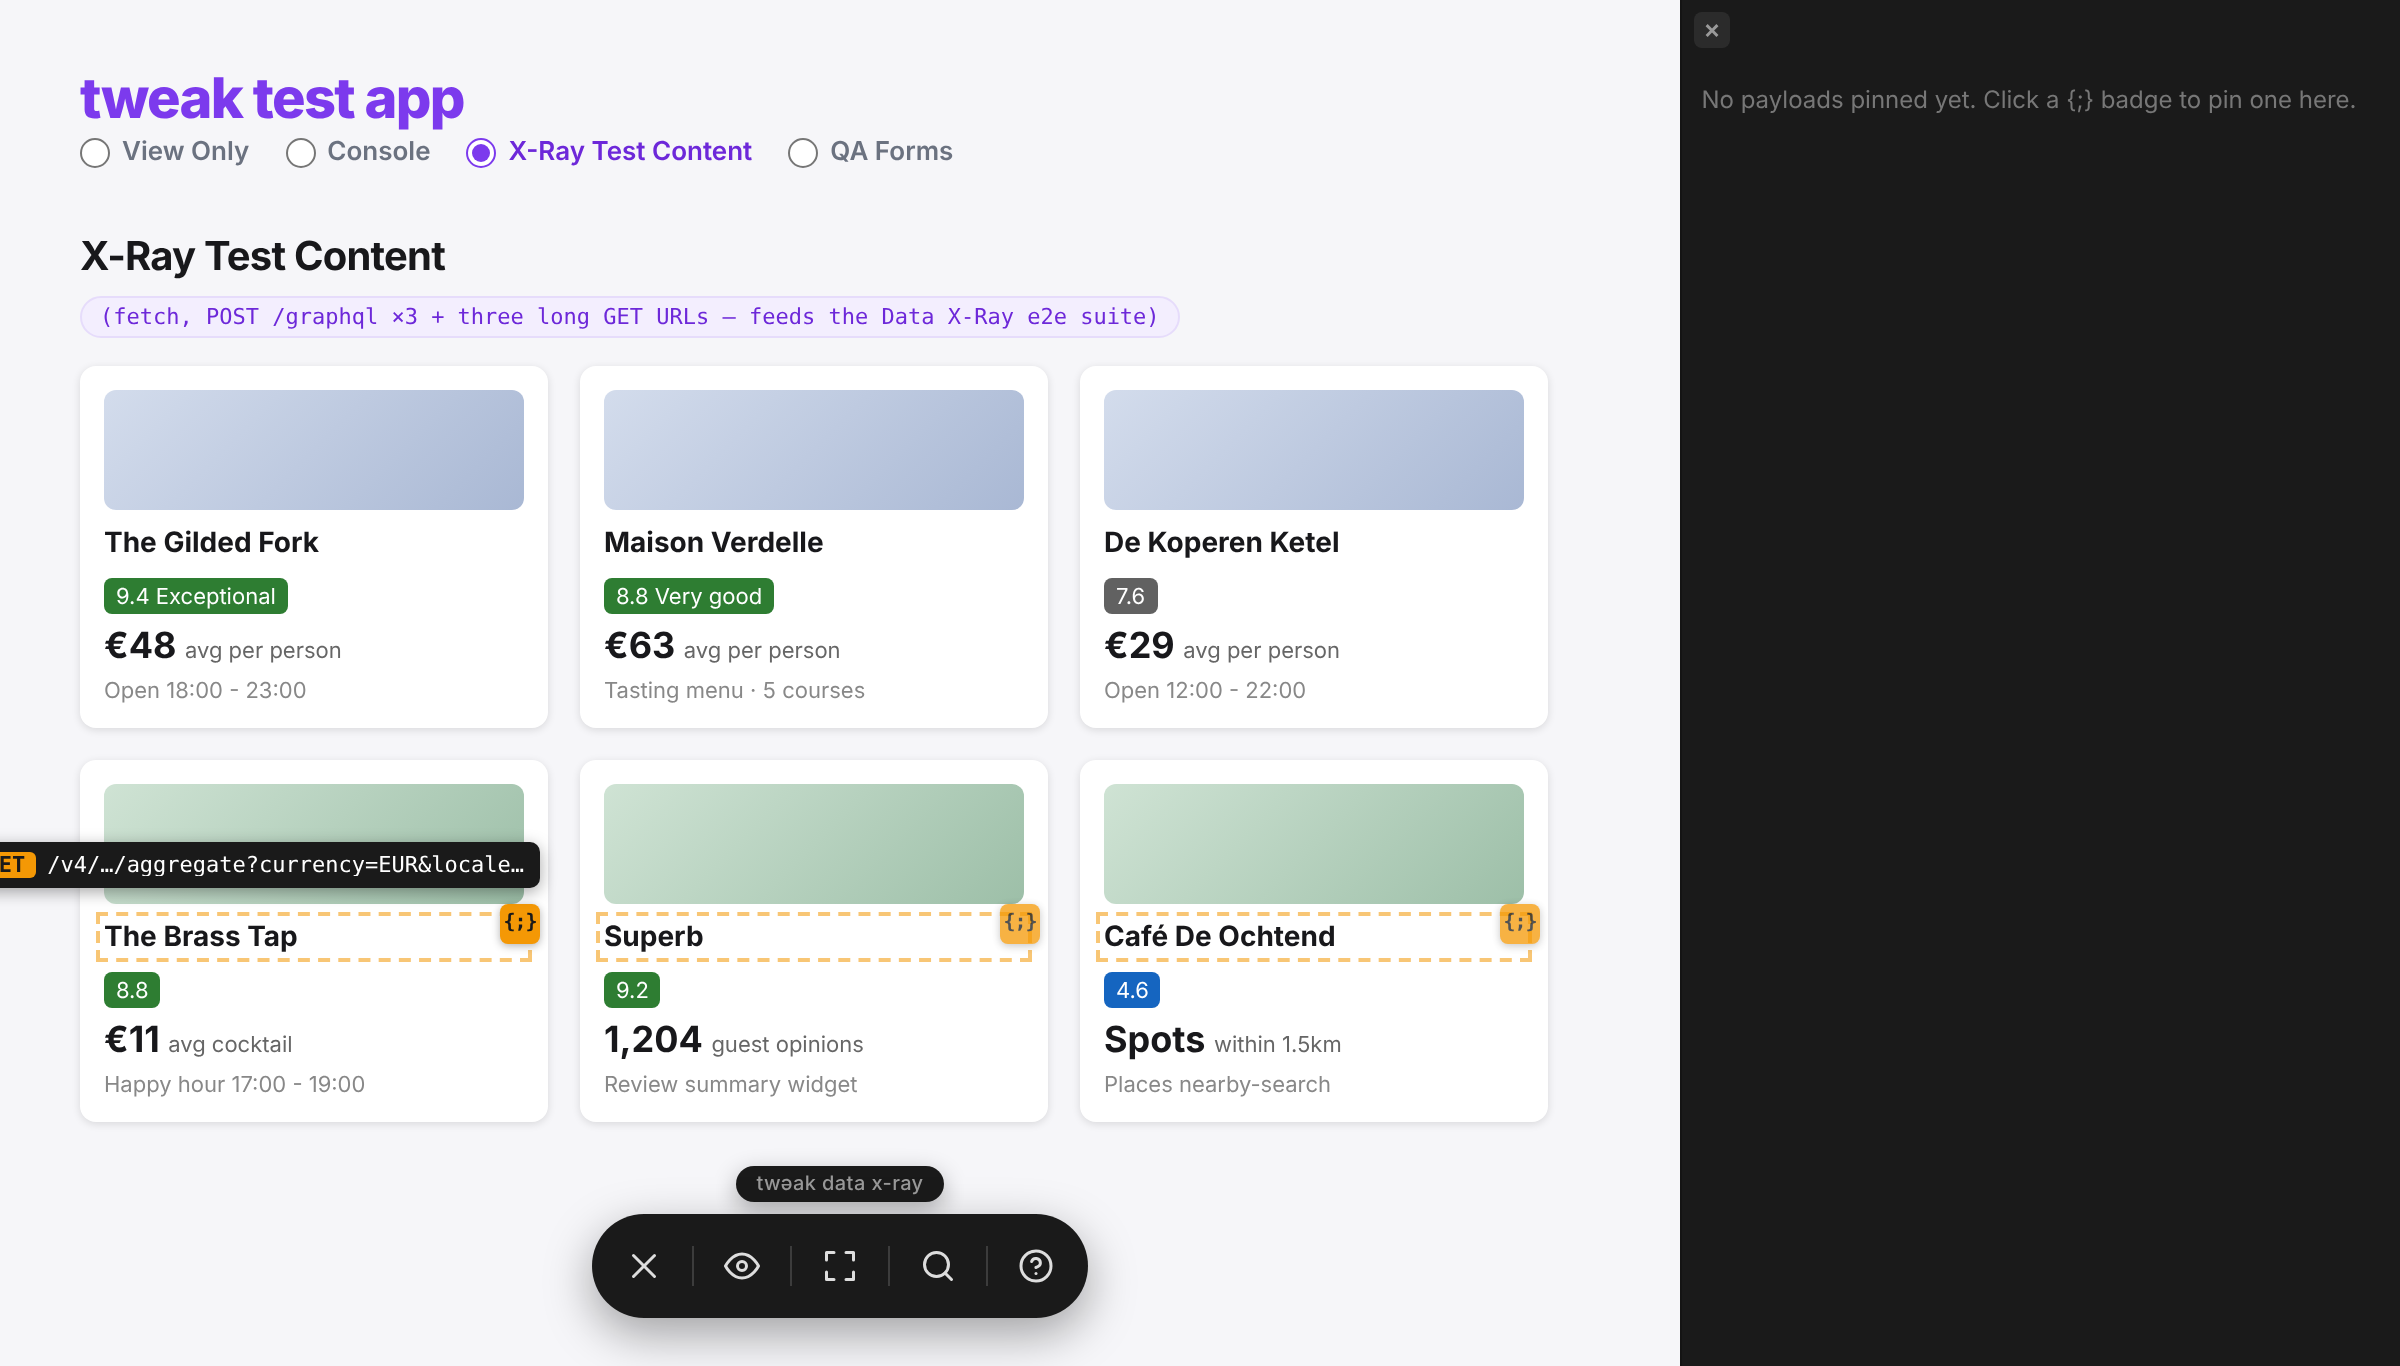
Hover a badge to see the method and URL (or the GraphQL operation name, for GraphQL requests) without opening anything:
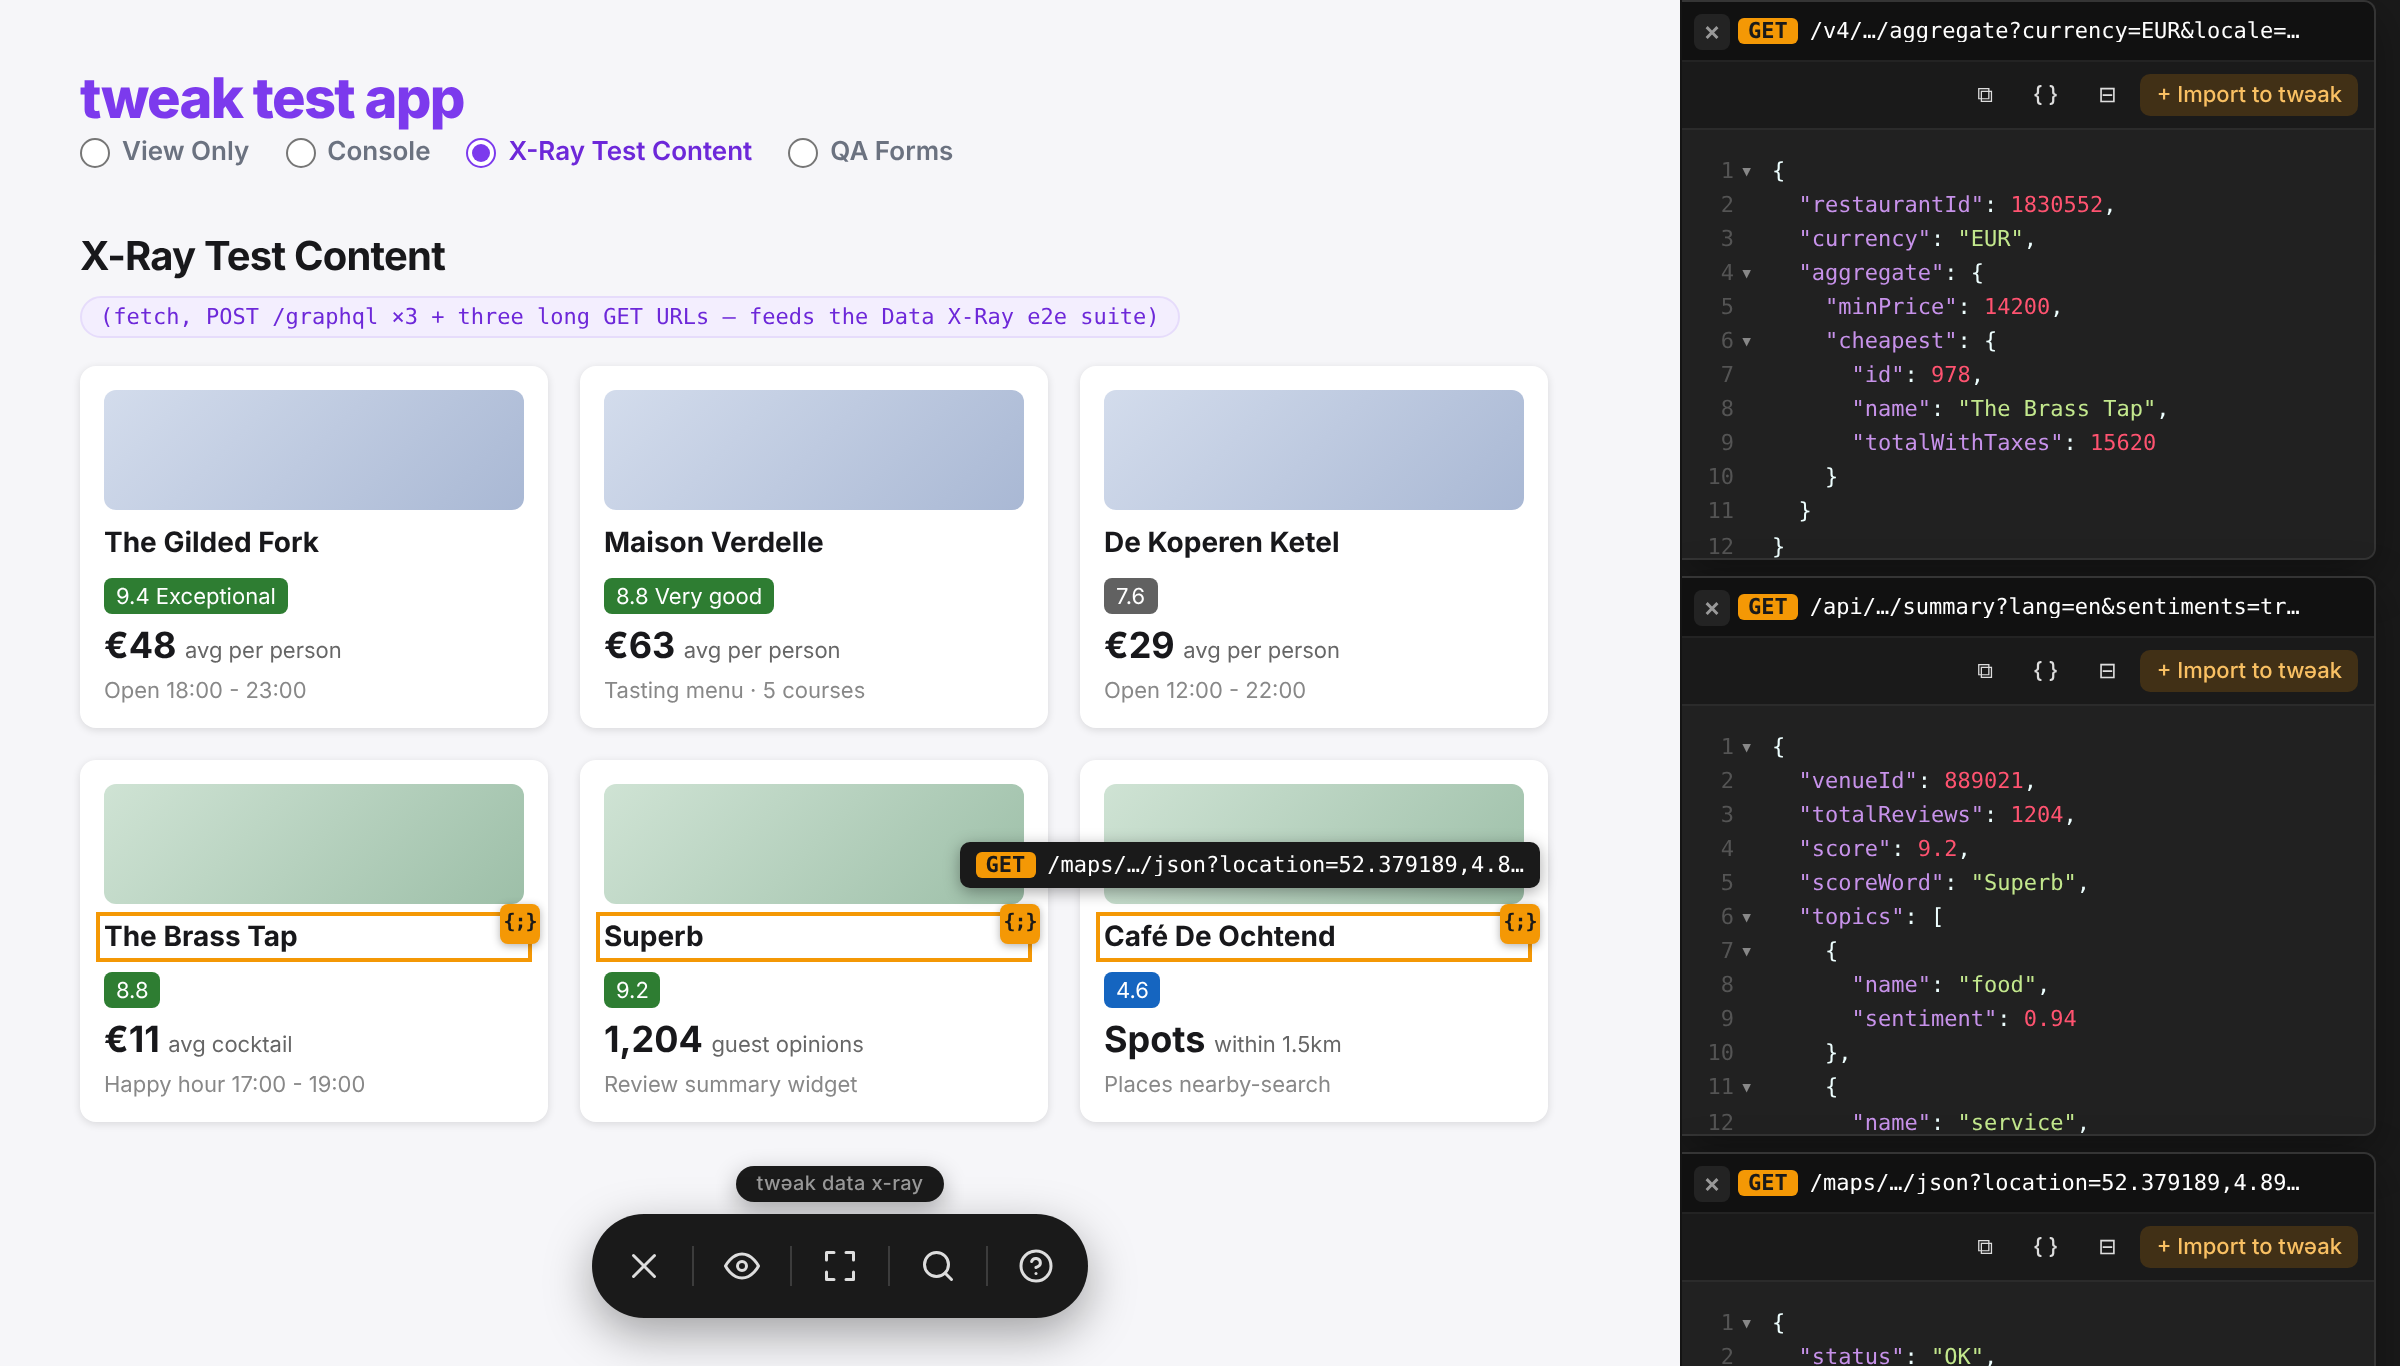
Click a badge to pin the full request/response payload into an editor in the right sidebar. The editor sits alongside the element it describes:
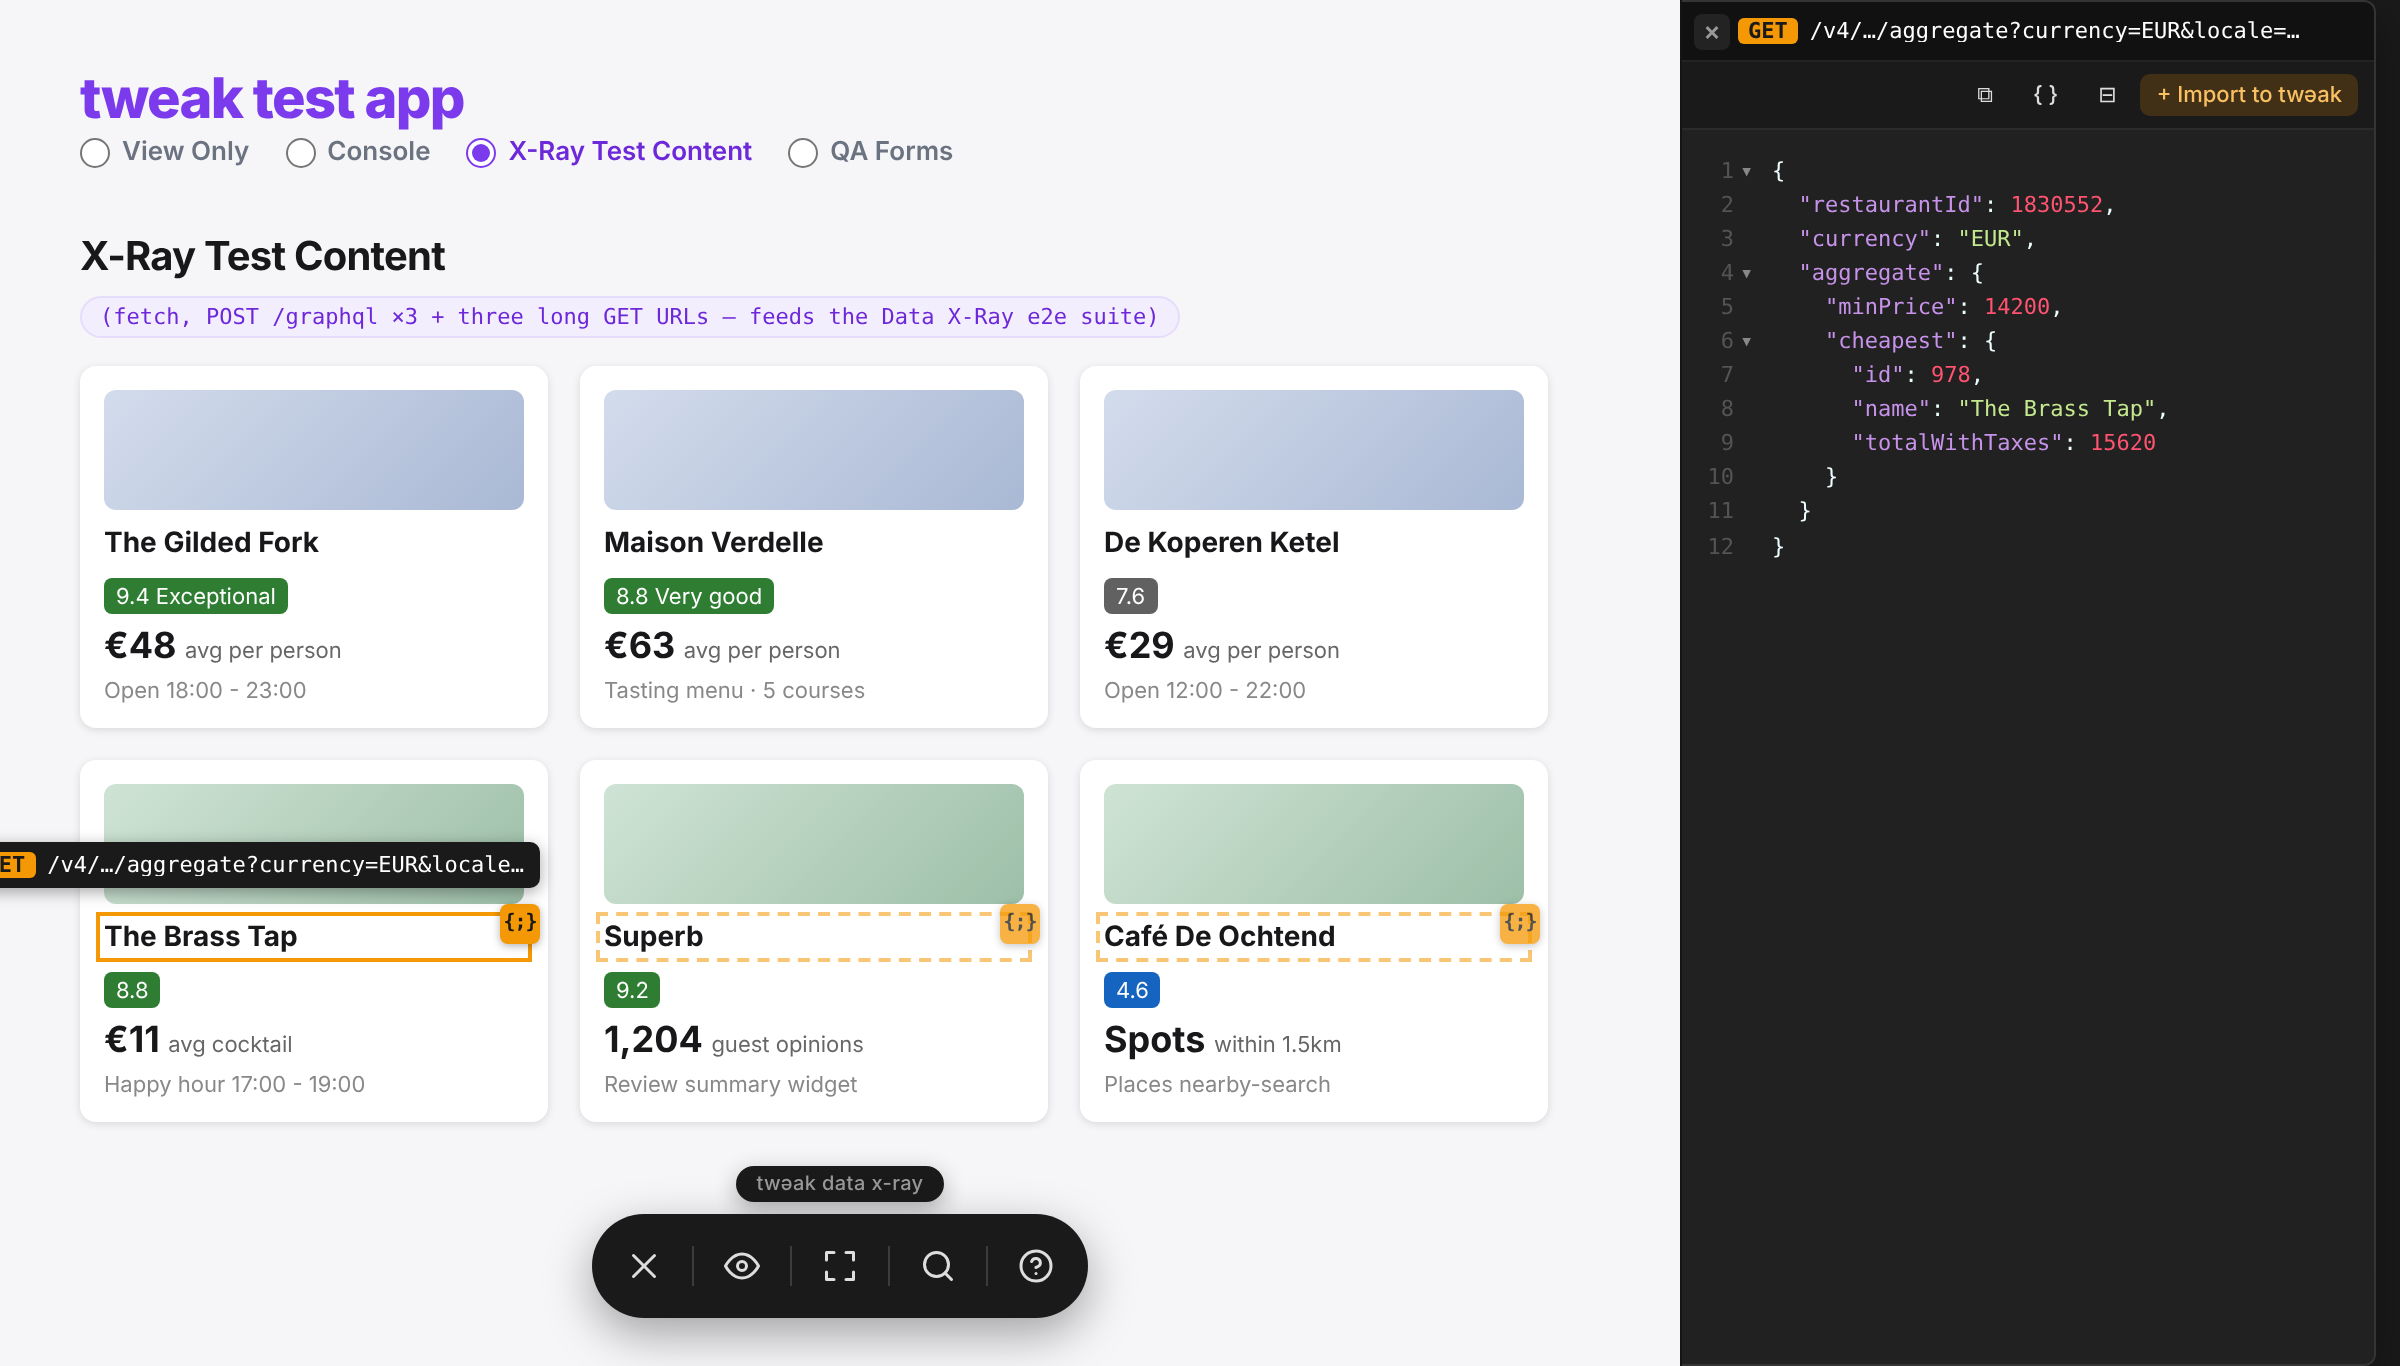
- If the request had a body, Request / Response tabs let you switch between what was sent and what came back.
- The payload is editable: tweak it directly in the editor before importing.
- Use the copy button to grab the payload, or + Import to twəak to turn it into a rule (see below).
- Clicking multiple badges pins multiple editors side by side (or stacked, depending on how many are open):
Use Cmd/Ctrl+F while an editor is focused to search within that payload. The magnifying-glass icon in the bottom bar opens a global search across every pinned editor at once.
Import a request as a rule
Click + Import to twəak on any pinned editor to create a rule from that request. The rule is created disabled, so it never applies until you review and enable it. Any edits made in the payload editor before importing are carried over.
The global bar
A floating bar at the bottom of the page gives you session-level controls:
- ✕ closes Data X-Ray entirely and restores the page.
- Eye icon expands all chips at once, useful for scanning many badges quickly.
- Crop icon selects a new region on the same page without reopening the popup.
- Magnifying glass toggles the global search bar across all pinned editors.
?links back to these docs.
Keyboard shortcut
Ctrl+Shift+K (Cmd+Shift+K on Mac) activates Data X-Ray directly, without opening the popup first, as long as some requests have already been captured for the tab.
Need something else? Request a feature